Look, I want to walk you through something important that HousingWire recently covered, because it changes how we should think about who actually owns homes in this country. The Federal Reserve Bank of Minneapolis put out some research showing that the number we all hear about homeownership, which is around sixty-five percent, is actually measuring something different than what most of us think. That number tells us what share of housing units are occupied by owners, not how many actual people own homes. It's an important distinction.
According to this research, when you measure it the right way by counting individual adults who are homeowners, the real number comes out to about fifty-three percent. The difference comes down to all those adult children living with their parents, older parents living with their kids, and other family or friends sharing owner-occupied homes. About one in seven American adults live in homes owned by someone else in their household but aren't owners themselves, yet the traditional measure counts them as homeowners.
What really caught my attention is how this reshapes our understanding of younger people specifically. The old way of measuring shows that thirty-seven percent of households headed by people under thirty-five are owner-occupied, but when you count the actual adults in that age group, only twenty-two percent of them own homes. That's a huge gap, and it mostly reflects how many young adults are living back with their parents who happen to own homes.
The research also shows that expensive housing markets like California and Utah see a much bigger difference between the two measurement methods than affordable states do. In states with high home prices, the gap is almost fifteen percentage points, while in places like the Dakotas it's less than six points. This suggests that high housing costs push more adults to share homes rather than own individually.
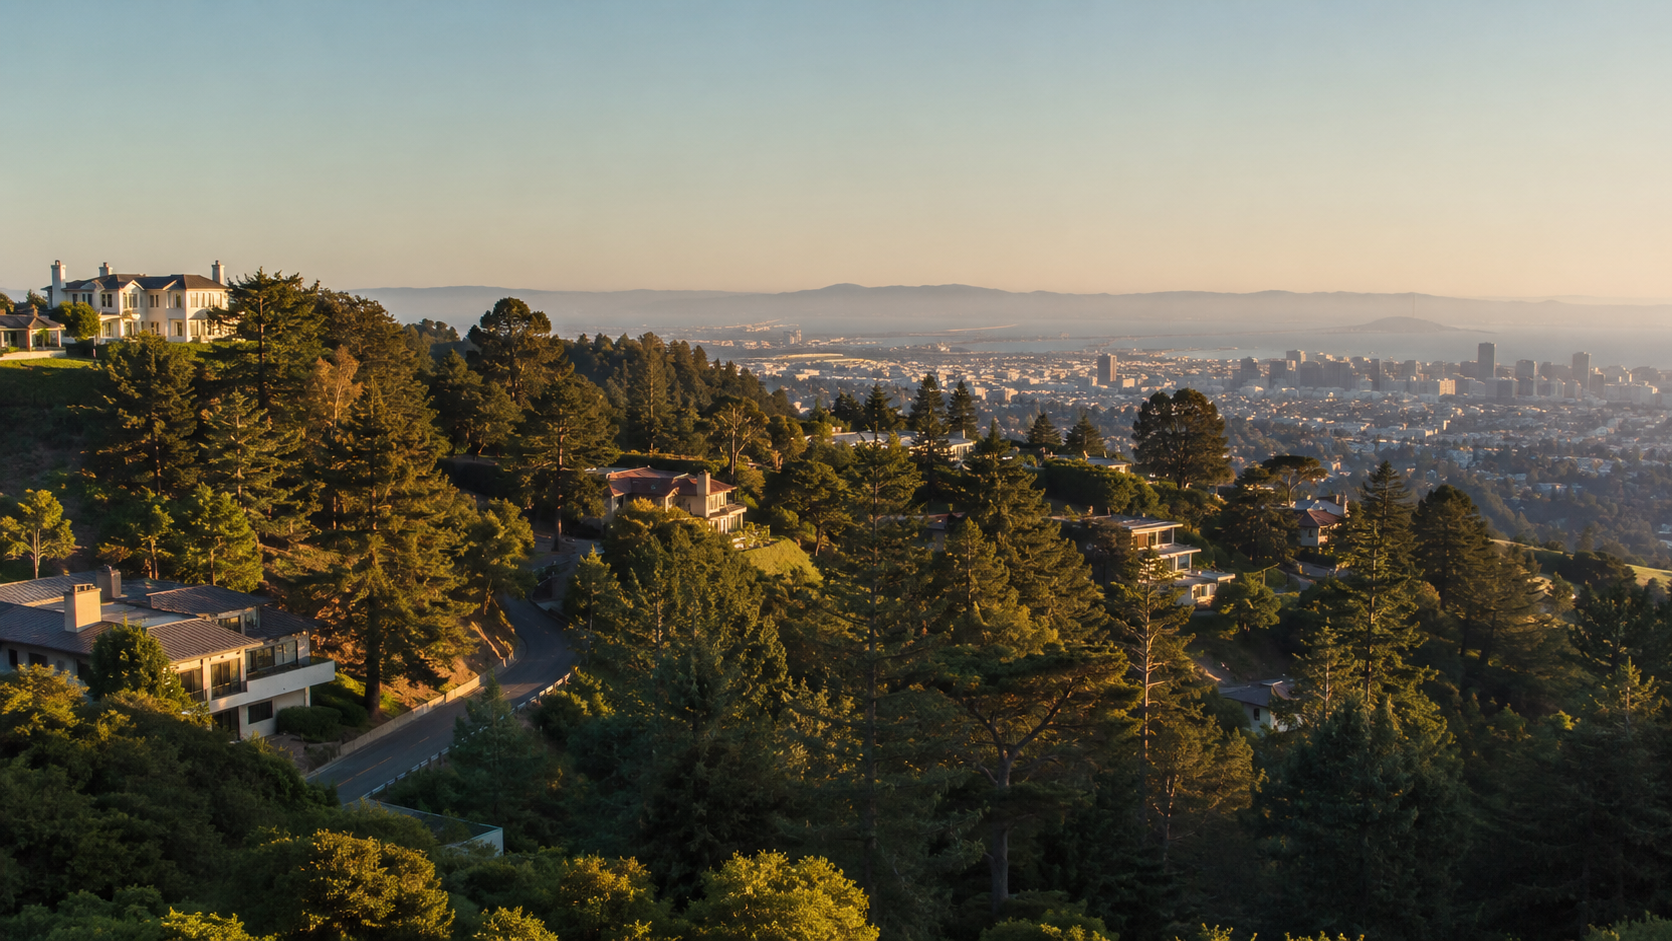
What I'm seeing locally here in the Bay Area is exactly what this data describes. We've got so many young professionals and families living with parents or in multi-family households just to afford our market. When people ask me about homeownership trends, I need to be honest about what the real picture looks like beyond those headline percentages. The true measure of how many Bay Area and East Bay adults can actually own their own home is lower than folks might think, and that reality should shape how we're thinking about affordability and policy here.